Data Stories
Generate Data Story Overlays in Seconds with AI
Describe your numbers, chart style, and motion. Get animated dashboards, funnels, and stat cards with transparency—ready for explainers and documentaries.
Examples
Data Story Styles You Can Generate
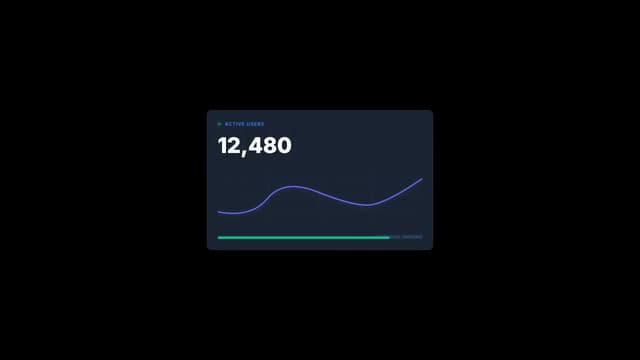
Active users dashboard card
Dark navy card with a green live dot, bold 12,480 metric, purple spline chart, and STATUS: TRACKING footer—real-time SaaS dashboard overlay.

Ecosystem growth network
Radiating node graph with teal and gold dots behind blurred Ecosystem Growth serif type—network expansion and partnership stories.
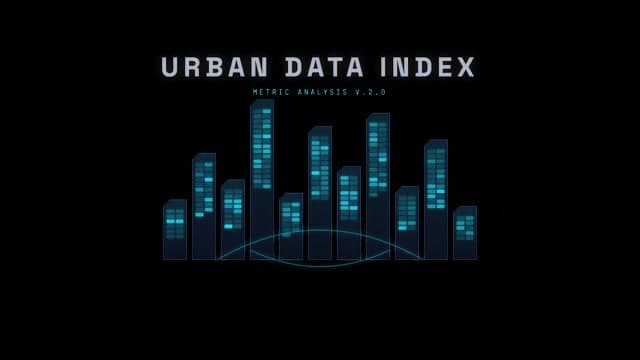
Urban data index skyline
Glowing cyan URBAN DATA INDEX title with bar-chart skyline windows and METRIC ANALYSIS V.2.0 sublabel—futuristic city metrics HUD.

System resonance orbs
Overlapping violet and cyan translucent circles with particle cluster and spaced SYSTEM RESONANCE caps—abstract tech brand data moment.
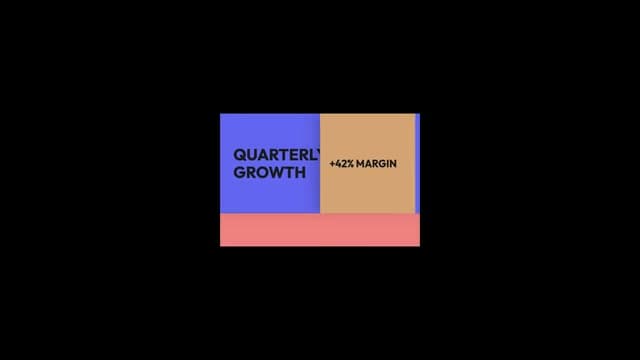
Quarterly growth blocks
Bold blue and tan rectangles with QUARTERLY GROWTH and +42% MARGIN type on a salmon footer bar—editorial finance motion graphic.
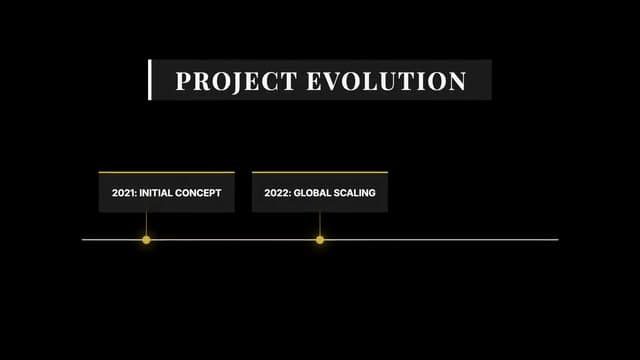
Project evolution timeline
PROJECT EVOLUTION header with yellow milestone dots, vertical connectors, and 2021/2022 phase boxes—roadmap and product history storytelling.
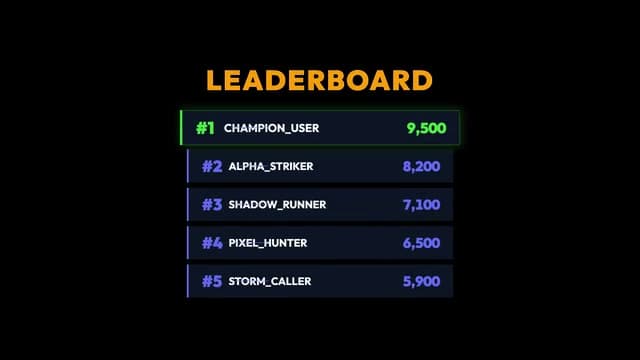
Gaming leaderboard
Orange LEADERBOARD title with ranked rows, neon #1 CHAMPION_USER highlight, and blue score columns—esports and stream stat overlays.
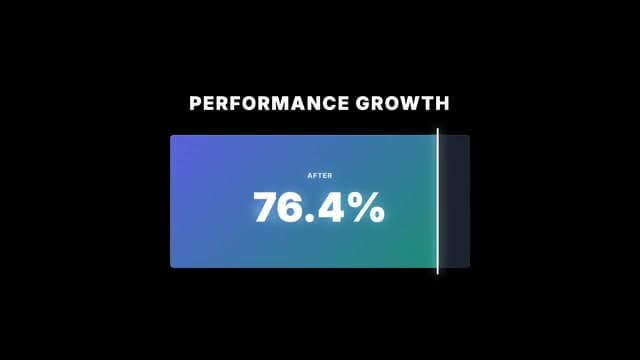
Performance growth bar
Purple-to-teal gradient progress card with AFTER label and 76.4% metric—before/after improvement stories for ads and case studies.
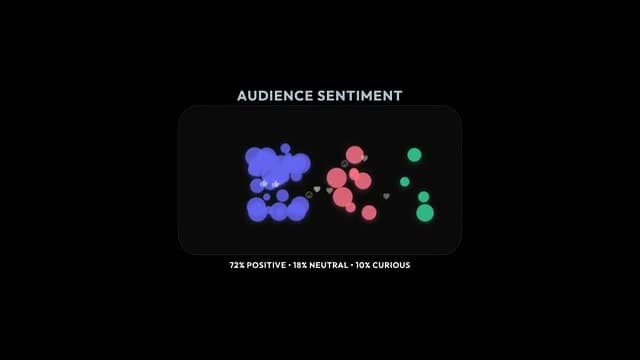
Audience sentiment clusters
Glowing blue, red, and green bubble clusters with 72% POSITIVE • 18% NEUTRAL • 10% CURIOUS breakdown—social listening and survey results.
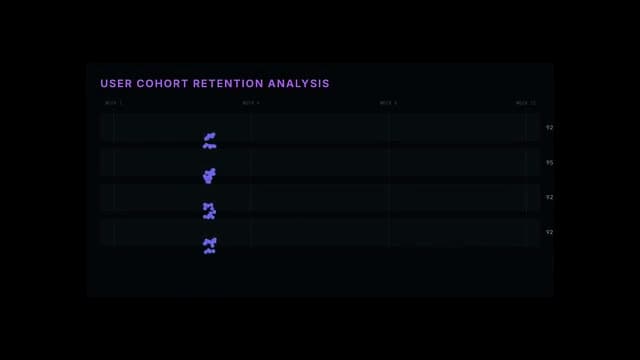
Cohort retention analysis
Purple dot trails across WEEK 1–12 grid with USER COHORT RETENTION ANALYSIS header—SaaS retention and product analytics explainers.
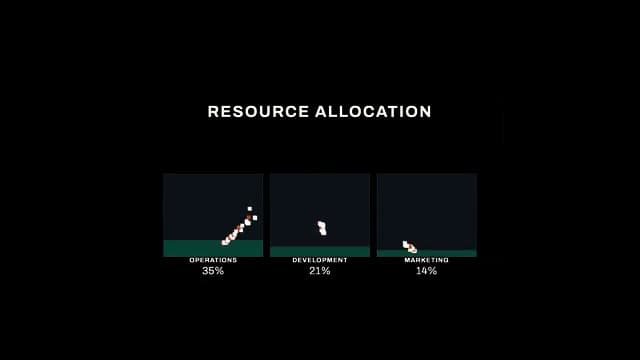
Resource allocation panels
Three falling-block columns for OPERATIONS 35%, DEVELOPMENT 21%, and MARKETING 14%—budget split and ops breakdown graphics.
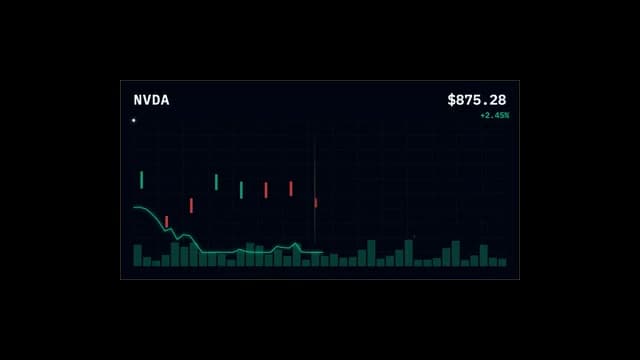
NVDA stock chart
Dark trading card with $875.28 price, +2.45% green delta, candlesticks, trend line, and volume bars—finance and market recap overlays.

Metric reveal beat
Minimal dark-frame data pulse that brings a key stat into focus—clean beat for documentary pacing between talking-head segments.

Hidden pattern HUD
Mystic hexagram HUD with glowing 87% SYNERGY center and THE HIDDEN PATTERN label—esoteric data story and conspiracy-doc aesthetics.

Temperature anomaly chart
Serif GLOBAL TEMPERATURE ANOMALY title with minimalist rising curve and orange highlight dots—editorial climate and science storytelling.
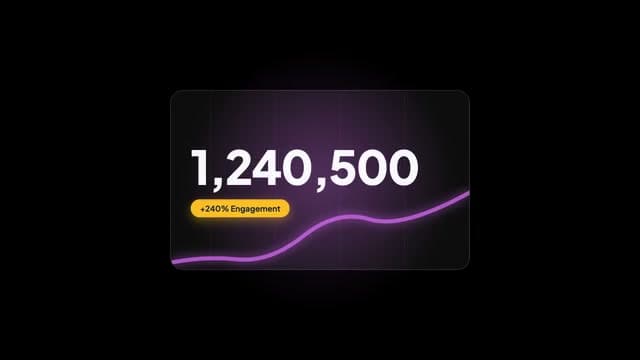
Engagement surge card
Purple glass card with 1,240,500 count, +240% Engagement yellow badge, and glowing trend line—viral growth and campaign results.

Accuracy ring stat
Slanted navy HUD tile with ALEX STRIKER, ACCURACY label, and 98 in a cyan progress ring with purple corner brackets—sports and esports stats.
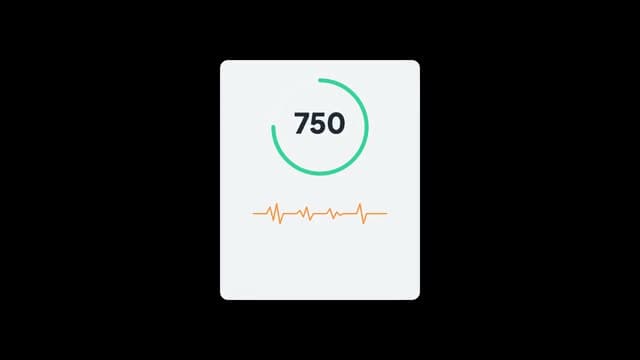
Health metric card
Light card with mint 750 progress ring and orange ECG pulse line—wellness, fitness, and biometric data story moments.
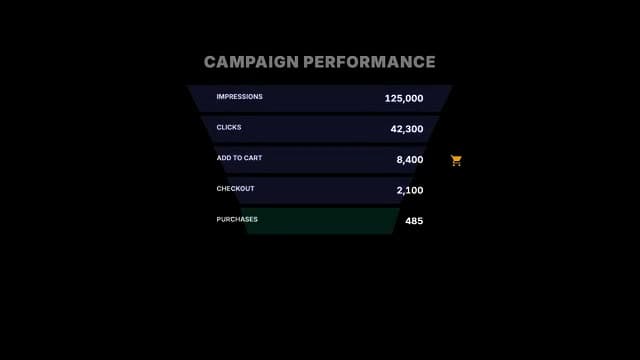
Campaign performance funnel
Purple-to-green CAMPAIGN PERFORMANCE funnel from 125K impressions down to 485 purchases with cart icon—marketing conversion explainers.

Neural analytics HUD
NEURAL ANALYTICS panel with 75% cyan ring, purple network graph, model confidence 98.42%, and hex status logs—AI and tech keynote graphics.
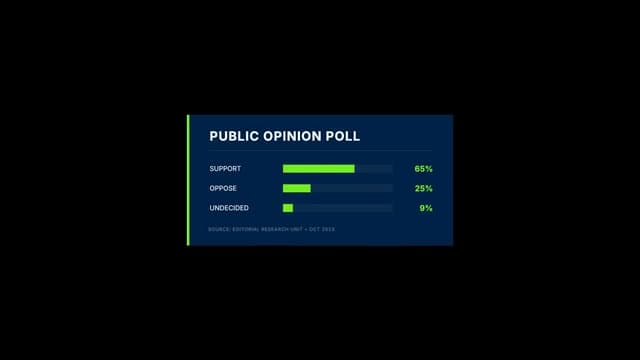
Public opinion poll
Navy poll card with lime SUPPORT/OPPOSE/UNDECIDED bars at 65%, 25%, and 9% plus editorial source footer—election and survey breakdown overlays.
How It Works?
From Idea to Timeline in 3 Steps
Generate
Simply type what you need. Tell us your style, colors, timing, and any other preferences.
Customize
Make quick, easy adjustments until the overlay looks exactly the way you imagined it.
Export
Download with a transparent background and drop your overlays straight into your editor.
Brand kits
Keep Every Data Viz On Brand
Set your colors, fonts, and style once in a brand kit. Then generate matching charts, counters, and dashboards for every video in your series.
Start your brand kitColor Palette
Typography
Color Palette
Typography
Color Palette
Typography
Color Palette
Typography
Color Palette
Typography
Popular with
Creators Who Use Data Stories
Ready to Create Your Data Story Overlay?
No spreadsheet design skills needed. Describe your data and visual style, then export a transparent overlay for Premiere, CapCut, or OBS.
Generate data storyNo credit card required.
FAQ
Got Questions?
- What format do I get?
- You export WebM or MOV video with native alpha channel (transparency). Resolution is up to Full HD 1080p. The file is ready to import into any major video editor or streaming software.
- Which software does it work with?
- Videohead exports videos with alpha channel, which works with Adobe Premiere Pro, DaVinci Resolve, CapCut, OBS Studio, and Final Cut Pro. You drag and drop the file into your timeline or add it as a source in OBS.
- How do I import overlays into my editor?
- Export WebM or MOV with alpha from Videohead, then follow our step-by-step guides for OBS Studio, DaVinci Resolve, or CapCut Desktop. Each guide walks you through adding the file to your timeline or OBS scene—no green screen required.
- Do I need design or editing skills?
- No. You only need to describe in text what you want—style, colors, text, timing—and Videohead generates the overlay. You can preview it in the browser and export when you're happy with it.
- Do I have to regenerate everything to tweak text or details?
- No. You don't need to regenerate for every small change. After generation, Videohead gives you controls to tune timing, copy, colors, and other settings the overlay exposes; the preview updates as you adjust them. Regenerate when you want a substantially different concept, not for every millisecond tweak.
- Is Videohead free?
- You can start for free: new accounts include a small bundle of generation credits to try the product. When you need more, you can buy credit packs without a subscription.
- What kinds of data can I visualize?
- Percentages, growth metrics, poll results, funnels, timelines, leaderboards, stock ticks, and more. Put the numbers and chart type in your prompt—bar, line, ring, or dashboard card.
- Can I animate numbers counting up?
- Yes. Mention count-up motion, odometer style, or ticker behavior in your prompt. After generation, tweak text and value fields in the overlay controls without redoing the whole animation.
- Do data overlays work on vertical Shorts?
- Yes. Ask for a compact or vertical layout and Videohead can generate a 9:16-friendly stat card. Export with alpha and place it in CapCut, Premiere, or your mobile editor.